Előadást letölteni
Az előadás letöltése folymat van. Kérjük, várjon

1
Cardiovascularis kockázatcsökkentés a diabetológus szemével
Balatonaliga, május 27. Dr. Jermendy György Bajcsy-Zsilinszky Kórház Budapest.

2
Diabetes mellitus aetiológiai diagnózisa
(WHO 1999) 1-es típusú diabetes 2-es típusú diabetes Egyéb speciális típusok Gesztációs diabetes
 1-es típusú diabetes. 2-es típusú diabetes. Egyéb speciális típusok. Gesztációs diabetes.")
3
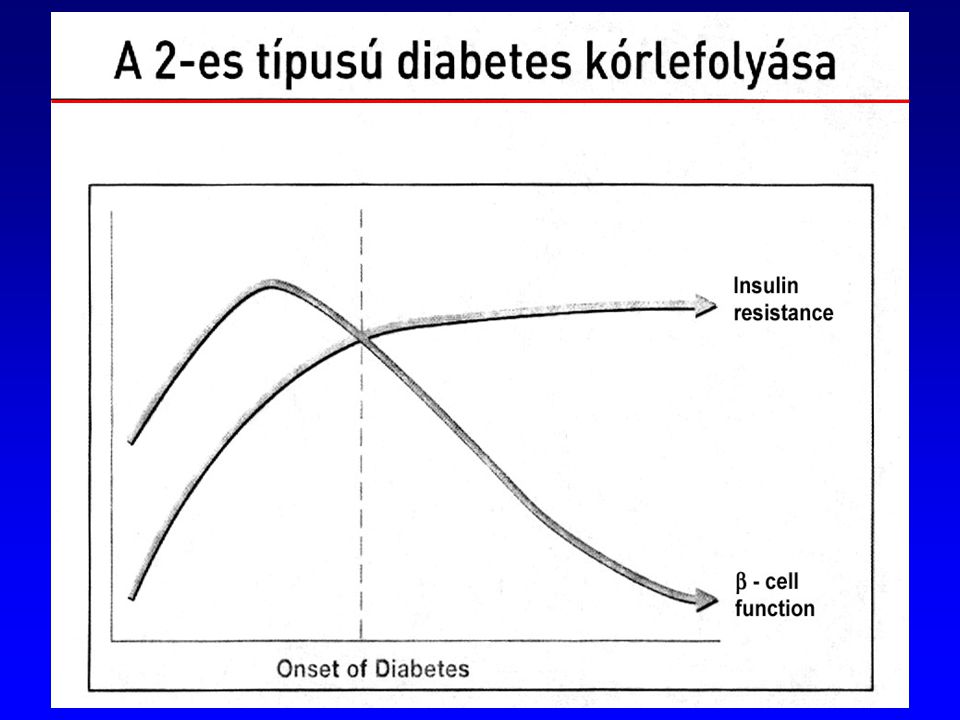
2-es típusú diabetes mellitus
(WHO 1999) Insulinsecretiós-zavar Insulinrezisztencia
 Insulinsecretiós-zavar. Insulinrezisztencia.")
5
Diabetes mellitus diagnózisa (WHO 1999)
IFG: éhomi vércukor 6,1 – 6,9 mmol/l IGT: 120 perces vércukor 7,8 – 11,1 mmol/l

7
KOCKÁZATI BESOROLÁS I. Nagy kockázat I/1 - Koszorúér-betegség, vagy
- Perifériás érbetegség, vagy - Cerebrovascularis szindróma I/2 - Diabetes mellitus - 2-es típus, vagy - 1-es típus mikro- vagy makroalbuminuriával, vagy - Metabolikus szindróma (az ATP III kritériumrendszere szerint) I/3 Tünetmentes, nagy kockázatú állapot - Fatális kardiovaszkuláris esemény előfordulási kockázata 5%/10 év*, vagy - Egy súlyos kockázati tényező megléte: - összkoleszterin >8,0 mmol/l, vagy - a vérnyomásérték >180/110 Hgmm, vagy - a testtömegindex (BMI) >40 kg/m2 * a koszorúér-esemény kockázatának becslésére használható a Framingham táblázat is (>20%/10 év)
 I/3 Tünetmentes, nagy kockázatú állapot. - Fatális kardiovaszkuláris esemény előfordulási kockázata 5%/10 év*, vagy. - Egy súlyos kockázati tényező megléte: - összkoleszterin >8,0 mmol/l, vagy. - a vérnyomásérték >180/110 Hgmm, vagy. - a testtömegindex (BMI) >40 kg/m2. * a koszorúér-esemény kockázatának becslésére használható a Framingham táblázat is (>20%/10 év)")
8
A hypertonia kórjóslatát befolyásoló kockázati fokozatok (ESC-ESH 2003)
Egyéb kockázati tényezők és kórelőzményi adatok Magas normális vérnyomás I. fokozat Enyhe hypertonia II. fokozat Középsúlyos hypertonia III. fokozat Súlyos hypertonia Nincs más kockázati tényező Általános Alacsony Közepes Fokozott 1-2 egyéb kockázati tényező Kifejezett 3 kockázati tényező, vagy célszervkárosodás, vagy diabetes mellitus Társuló klinikai kórformák

9
A 2-es típusú diabetes olyan idült cardiovascularis állapot,
amely hyperglycaemiával jár!

10
A metabolikus szindróma alapvető összetevői
inzulinrezisztencia - hyperinsulinaemia glukóz-intolerancia (IFG, IGT, DM) hypertonia dyslipidaemia elhízás (centrális típusú) Accelerált atherosclerosis
 hypertonia. dyslipidaemia. elhízás (centrális típusú) Accelerált atherosclerosis.")
11
A metabolikus szindróma vitatott összetevői
· hyperuricaemia · PAI-1 növekedés · hyperhomocysteinaemia · CRP-növekedés · hyperfibrinogenaemia · microalbuminuria · polycystás ovarium syndroma · alvási apnoe syndroma · cardiovascularis autonom neuropathia · nem alkoholos steatohepatitis (NASH)
")
12
A metabolikus szindróma patomechanizmusában szerepet kapó további tényezők
· sympathicus aktivitás fokozódása - leptin növekedése · rezisztin növekedése · TNF-alfa, IL-6 növekedése · szabad zsírsavszint növekedése · adiponectin csökkenése · endothel diszfunkció · oxidatív stressz

13
Insulin resistance and cardiovascular disease
Genetic and environmental factors Insulin Resistance Insulin Resistance Syndrome NEFA, triglycerides HDL Small dense LDL BP, PAI-1, Blood viscosity, Platelet aggregation, Microalbuminuria, BPH Low-grade chronic inflammation Activated Cytokine production (eg TNFα, IL-6, IL-1β) Macrophages Acute phase proteins (eg CRP) NOTE: This slide contains animation – activated via four mouse-clicks. The Verona Diabetes Complications Study showed that, in diabetic and non-diabetic subjects, insulin resistance is associated with several cardiovascular risk factors, including hyperglycaemia, dyslipidaemia and hypertension. The study identified insulin resistance as an independent risk factor for cardiovascular disease.1 Several studies have demonstrated that insulin resistance precedes the development of type 2 diabetes and may be present 2–3 decades before its onset.2 An estimated 50% of patients show signs of macrovascular disease prior to diagnosis.3 NEFA: NEFA is the form of free fatty acid (FFA) that is released from adipose tissue via enzymic hydrolysis of triglycerides. HDL (high-density lipoprotein) + LDL (low-density lipoprotein): These are forms of cholesterol. HDL cholesterol concentrations are increased and there is a preponderence of small dense, atherogenic, LDL particles in patients. PAI-1 (plasminogen activator inhibitor-1): PAI-1 is a major regulator of plasminogen activation and plays an important role in blood clotting. PAI-1 concentrations are increased in patients with type 2 diabetes. BPH (benign prostatic hyperplasia): BPH is a disease that involves the enlargement of the prostate, particularly in elderly men. There is a strong association between insulin resistance and BPH. TNF (tumour necrosis factor-): This cytokine plays a key role in mediating pathological inflammation. It is now known to exert a variety of catabolic effects which may impair cellular insulin action, increase lipolysis and inhibit glucose transporter 4 (GLUT4) expression. IL-6, IL-1 (interleukin-6, interleukin-1): Interleukins are cytokines that act as mediators between leucocytes and play a role in the inflammatory process. CRP (C-reactive protein): CRP is a marker of systemic inflammation. MCP-1 (monocyte chemotactic protein-1): MCP-1 is involved in inflammation by mediating the migration of monocytes and T-cells into inflammatory sites. MMP-9 (matrix metalloproteinase-9): Matrix metalloproteinases are a family of membrane-bound zinc-endopeptidases that can degrade all of the components of the extracellular matrix and are implicated in the pathology of atherosclerotic plaque rupture. MMP-9 concentrations are raised in type 2 diabetes and may confer an increased risk of atherosclerotic disease. References 1. Bonora E, et al. Diabetes Care 2002; 25: 2. Beck-Nielsen H & the EGIR. Drugs 1999; 58 (Suppl 1):7-10. 3. Laakso M. Int J Clin Pract Suppl 2001; 121:8-12. CV morbidity and mortality Endothelial function (eg MCP-1, MMP-9) Arterial elasticity Atherosclerosis Cardiac vulnerability
 Macrophages Acute phase proteins (eg CRP) NOTE: This slide contains animation – activated via four mouse-clicks. The Verona Diabetes Complications Study showed that, in diabetic and non-diabetic subjects, insulin resistance is associated with several cardiovascular risk factors, including hyperglycaemia, dyslipidaemia and hypertension. The study identified insulin resistance as an independent risk factor for cardiovascular disease.1. Several studies have demonstrated that insulin resistance precedes the development of type 2 diabetes and may be present 2–3 decades before its onset.2. An estimated 50% of patients show signs of macrovascular disease prior to diagnosis.3. NEFA: NEFA is the form of free fatty acid (FFA) that is released from adipose tissue via enzymic hydrolysis of triglycerides. HDL (high-density lipoprotein) + LDL (low-density lipoprotein): These are forms of cholesterol. HDL cholesterol concentrations are increased and there is a preponderence of small dense, atherogenic, LDL particles in patients. PAI-1 (plasminogen activator inhibitor-1): PAI-1 is a major regulator of plasminogen activation and plays an important role in blood clotting. PAI-1 concentrations are increased in patients with type 2 diabetes. BPH (benign prostatic hyperplasia): BPH is a disease that involves the enlargement of the prostate, particularly in elderly men. There is a strong association between insulin resistance and BPH. TNF (tumour necrosis factor-): This cytokine plays a key role in mediating pathological inflammation. It is now known to exert a variety of catabolic effects which may impair cellular insulin action, increase lipolysis and inhibit glucose transporter 4 (GLUT4) expression. IL-6, IL-1 (interleukin-6, interleukin-1): Interleukins are cytokines that act as mediators between leucocytes and play a role in the inflammatory process. CRP (C-reactive protein): CRP is a marker of systemic inflammation. MCP-1 (monocyte chemotactic protein-1): MCP-1 is involved in inflammation by mediating the migration of monocytes and T-cells into inflammatory sites. MMP-9 (matrix metalloproteinase-9): Matrix metalloproteinases are a family of membrane-bound zinc-endopeptidases that can degrade all of the components of the extracellular matrix and are implicated in the pathology of atherosclerotic plaque rupture. MMP-9 concentrations are raised in type 2 diabetes and may confer an increased risk of atherosclerotic disease. References. 1. Bonora E, et al. Diabetes Care 2002; 25: Beck-Nielsen H & the EGIR. Drugs 1999; 58 (Suppl 1): Laakso M. Int J Clin Pract Suppl 2001; 121:8-12. CV morbidity and mortality. Endothelial function (eg MCP-1, MMP-9) Arterial elasticity. Atherosclerosis Cardiac vulnerability.")
14
A hyperinsulinaemia atherogen szerepe
EExperimentalis munkák - Stout RW: Diabetes Care 13: , 1990. - Cruz, AB. et al: Circ. Res. 9: 39-43, 1969. Klinikai megfigyelések - Paris Prospective Study - Helsinki Policemen Study

15
Increased insulin resistance is associated with increased CV risk
San Antonio Heart Study: HOMA-IR and 8-year risk of CV outcomes (1= risk of CVD for individuals in quintile 1) 5 4 HOMA-IR quintiles 3 This study investigated the relationship of the homeostasis model assessment of insulin resistance (HOMA-IR) with risk of cardiovascular disease (CVD) in 2,569 subjects who were free of diabetes at baseline over the 8-year follow-up of the San Antonio Heart Study. Over the follow-up period, 187 subjects experienced and incident cardiovascular event (heart attack, stroke, heart surgery, angina, or CVD death). The risk of CVD event increased across quintiles of HOMA-IR after adjustment for age, sex and ethnicity (p< for trend). Additional adjustment for LDL, triglyceride, HDL, systolic blood pressure, smoking, alcohol consumption, exercise and waist circumference (shown in slide) only modestly reduced the magnitude of these associations (p= for trend). Therefore, there is a significant association between HOMA-IR and risk of CVD after adjustment for multiple covariates. Reference Hanley AJ et al. Diabetes Care 2002; 25: 2 1 2 3 4 5 Odds ratio for risk of CVD (95% CI) Quintile of HOMA-IR adjusted for age, sex, ethnicity, LDL, triglyceride, HDL, systolic blood pressure, smoking, alcohol consumption, leisure time exercise and waist circumference (median split) *p= for increased CV disease risk across HOMA-IR quintiles Hanley AJ et al. Diabetes Care 2002; 25:
 HOMA-IR quintiles. 3. This study investigated the relationship of the homeostasis model assessment of insulin resistance (HOMA-IR) with risk of cardiovascular disease (CVD) in 2,569 subjects who were free of diabetes at baseline over the 8-year follow-up of the San Antonio Heart Study. Over the follow-up period, 187 subjects experienced and incident cardiovascular event (heart attack, stroke, heart surgery, angina, or CVD death). The risk of CVD event increased across quintiles of HOMA-IR after adjustment for age, sex and ethnicity (p< for trend). Additional adjustment for LDL, triglyceride, HDL, systolic blood pressure, smoking, alcohol consumption, exercise and waist circumference (shown in slide) only modestly reduced the magnitude of these associations (p= for trend). Therefore, there is a significant association between HOMA-IR and risk of CVD after adjustment for multiple covariates. Reference. Hanley AJ et al. Diabetes Care 2002; 25: Odds ratio for risk of CVD (95% CI) Quintile of HOMA-IR adjusted for age, sex, ethnicity, LDL, triglyceride, HDL, systolic blood pressure, smoking, alcohol consumption, leisure time exercise and waist circumference (median split) *p= for increased CV disease risk across HOMA-IR quintiles. Hanley AJ et al. Diabetes Care 2002; 25:")
16
Klinikai kórformák Inzulinrezisztencia Hyperinsulinaemia

17
Causes of mortality in diabetic patients
Myocardial infarction 34.7 Stroke 22 Tumors 10 Infections 6.7 Diabetic coma 3.1 Renal insufficiency 2.9 Gangrene 2.7 Accident / suicide 2.1 Tuberculosis 0.9 Others 11.4 Not specified 3.4 10 20 30 40 % deaths in diabetics Panzram G, Diabetologia 1987; 30:

19
Globális rizikókezelés
Improving the Prognosis of Patients with Type 2 Diabetes Slide 13. Treatment of Key Risk Factors - Choice of Therapy. Szénhidrát anyagcsere Hypertonia Kezelési lehetőségek Key modifiable risk factors for cardiovascular disease in the diabetic patient are hyperglycaemia, hypertension and dyslipidaemia. These are therefore the three main targets for therapeutic intervention. Antihypertensive and lipid-lowering treatments are important, but are outside the scope of this presentation. We will concentrate on a review of the evidence demonstrating that the choice of antidiabetic therapy and choice of treatment approach for managing hyperglycaemia have significant influence in reducing morbidity and mortality in type 2 diabetes. Lipid kontroll

20
Weight Loss in Type 2 Diabetes: an uphill struggle
Harder than for non-diabetics Only 3-5% in UKPDS achieved >10% loss for 1 year

21
A diabetológia alapvető kérdése:
Megelőzi-e az idült szövődmények kialakulását a tartósan jó anyagcsere-helyzet biztosítása?

22
Favors Intensive Thearpy Favors Conventional Thearpy
Effects of intensive blood glucose control on progression of nephropathy 0.02 0.05 0.1 0.2 0.5 1 2 5 10 20 50 266 Overall 94 1991 SDIS 7 43 1988 Oslo 6 21 1987 Christensen 5 36 1986 Steno 2 4 23 1985 Beck-Nielsen 3 29 1984 Steno 1 2 20 Kroc 1 #Pts Year Study Z = 3.95 p= Odds Ratio 95% CI Favors Intensive Thearpy Favors Conventional Thearpy Wang L. et al. The Lancet 1993.

23
DCCT (Diabetes Control and Complications Trial)
1-es típusú cukorbetegek (n=1441) életkor év között primer prevenciós csoport secunder prevenciós csoport intenzív vs konzervatív inzulin kezelés átlagos követési idő: 6,5 év microangiopathiás szövődmények regisztrálása New Engl J Med 329: , 1993.
 életkor év között. primer prevenciós csoport. secunder prevenciós csoport. intenzív vs konzervatív inzulin kezelés. átlagos követési idő: 6,5 év. microangiopathiás szövődmények regisztrálása. New Engl J Med 329: ,")
24
Goal of intensive therapy
DCCT (HbA1c értékek a konvencionális és az intenzív kezelésen lévő csoportban 11.0 HbA1C % 10.0 Con 9.0 8.0 Int 7.0 6.0 Goal of intensive therapy 5.0 1 2 3 4 5 6 7 8 9 Study years

25
retinopathia 76 % nephropathia 34 - 44 % neuropathia 69 %
DCCT alaperedmények a primer prevenciós csoportban (kockázatcsökkenés intenzív vs konzervatív inzulinterápia) retinopathia % nephropathia % neuropathia %
 retinopathia 76 % nephropathia % neuropathia 69 %")
26
retinopathia 23 – 54 % nephropathia 43 – 56 % neuropathia 57 %
DCCT alaperedmények a secunder prevenciós csoportban (kockázatcsökkenés intenzív vs konzervatív inzulinterápia) retinopathia – 54 % nephropathia – 56 % neuropathia %
 retinopathia 23 – 54 % nephropathia 43 – 56 % neuropathia 57 %")
27
DCCT alaperedmények a cardiovascularis szövődmények alakulása terén (kockázatcsökkenés intenzív vs konzervatív inzulinterápia) intenzív csoport ,5 esemény/100 betegév konzervatív csoport 0,8 esemény/100 betegév kockázatcsökkenés 41 %, NS.

28
DCCT-EDIC A DCCT-kohorsz követéses eredménye a cardiovascularis szövődmények alakulása terén (az eredetileg intenzív vs konzervatív inzulinterápián lévő csoportok között) carotis UH coronaria meszesedés (CT)
 carotis UH. coronaria meszesedés (CT)")
29
Improving the Prognosis of Patients with Type 2 Diabetes
UKPDS Improving the Prognosis of Patients with Type 2 Diabetes Slide 14. UKPDS: Picture of UK with 23 Investigator Sites. 23 Centrum Leghosszabb és legnagyobb prospektív vizsgálat 2-es típusú diabéteszben Oxford, UK. The evidence base on which to base a treatment policy for the control of hiperglikémia is UKPDS. UKPDS is the longest and largest prospective randomised controlled trial dedicated to a study of type 2 diabetics ever carried out. The study, managed from Oxford but conducted in 23 centres around the UK is also a rich source of epidemiology data on the natural history of diabetes. Lancet 352: , 1998.

30
Improving the Prognosis of Patients with Type 2 Diabetes
UKPDS: HbA1c változása 15 éven át Slide 19. UKPDS: Effects of Treatment on HbA1C over 15 Years. Keresztmetszeti; átlag 9 Konvencionális 8 Átlag HbA1c (%) Intenzív Throughout the study, intensive glucose control (squares) provided better glycaemic control compared with the conventional management policy (circles), as shown for HbA1C on this slide. HbA1C increased steadily with time in the conventional treatment arm. The intensive glucose control regimen induced an initial fall in HbA1C over the first year, after which this parameter also increased at a similar rate. Intensive therapy achieved significantly lower HbA1C values throughout the study, with a median difference of 0.9% over 10 years (7.0% in the intensive group vs 7.9% in the conventional group, p<0.0001). However, intensive treatment based primarily on a monotherapy approach, did not maintain optimal glycaemic control reflecting the progressive nature of type 2 diabetes. 7 6.2%=a normál tartomány felső határa 6 3 6 9 12 15 Évek a randomizációtól UKPDS Group. Lancet 1998;352:837–853.
 Intenzív. Throughout the study, intensive glucose control (squares) provided better glycaemic control compared with the conventional management policy (circles), as shown for HbA1C on this slide. HbA1C increased steadily with time in the conventional treatment arm. The intensive glucose control regimen induced an initial fall in HbA1C over the first year, after which this parameter also increased at a similar rate. Intensive therapy achieved significantly lower HbA1C values throughout the study, with a median difference of 0.9% over 10 years (7.0% in the intensive group vs 7.9% in the conventional group, p<0.0001). However, intensive treatment based primarily on a monotherapy approach, did not maintain optimal glycaemic control reflecting the progressive nature of type 2 diabetes %=a normál tartomány felső határa Évek a randomizációtól. UKPDS Group. Lancet 1998;352:837–853.")
31
UKPDS: Klinikai következmény
Improving the Prognosis of Patients with Type 2 Diabetes Slide 20. UKPDS: Effects of Treatment on Clinical Outcomes. Intenzív 7.0% HbA1c Konvencionális 7.9% HbA1c vs 12% 16% 25% 21% Diabétesszel összefüggő végpont Miokardiális infarktus Mikrovaszkuláris szövődmények Retinopátia 12 év-nél P=0.029 P=0.052 P=0.0099 P=0.015 NS The results of UKPDS demonstrated that intensification of glucose control significantly reduced the incidence of diabetes-related complications by 12%.a This reduction was mainly driven by fewer microvascular complications, as shown on the slide. Changes in the incidence of myocardial infarction were of borderline significance (p=0.052) with no significant reduction in all-cause mortality (reduced by 6%, p = 0.44) or diabetes-related deaths (reduced by 10%, p = 0.34) (not shown on the slide). aDefinition of any diabetes related endpoint: time to first occurrence of sudden death, death from hiperglikémia/hypoglycaemia, fatal or nonfatal myocardial infarction, angina, heart failure, stroke, renal failure, amputation of at least one digit, vitreous haemorrhage, retinal photocoagulation, blindness in one eye, or cataract extraction. Kardiovaszkuláris és összmortalitás
 with no significant reduction in all-cause mortality (reduced by 6%, p = 0.44) or diabetes-related deaths (reduced by 10%, p = 0.34) (not shown on the slide). aDefinition of any diabetes related endpoint: time to first occurrence of sudden death, death from hiperglikémia/hypoglycaemia, fatal or nonfatal myocardial infarction, angina, heart failure, stroke, renal failure, amputation of at least one digit, vitreous haemorrhage, retinal photocoagulation, blindness in one eye, or cataract extraction. Kardiovaszkuláris és összmortalitás.")
32
Hyperglykaemia és szövődmények
Improving the Prognosis of Patients with Type 2 Diabetes Slide 46. UKPDS: Association of hiperglikémia and Complications. 2-es típusú diabetes 60 50 Myocardialis infarctus 40 % Incidencia beteg-évenként The consequences of failure-based management approaches in diabetes can be severe, as inadequate control of blood glucose causes unnecessary exposure of patients to additional risk of microvascular and macrovascular complications. In UKPDS, increasing HbA1C from 6% to 9% approximately doubles the risk of a myocardial infarction. In addition, the risk of microvascular complications increases markedly as HbA1C rises. Management approaches which achieve near normal glycaemic control are likely to have the biggest impact in reducing the incidence of heart attacks. 30 Mikrovaszkuláris betegségek 20 10 <6 6-<7 7-<8 8-<9 9-<10 10+ HbA1c (%) UKPDS 35. BMJ 2000; 321:
 UKPDS 35. BMJ 2000; 321:")
33
HbA1c and rizikócsökkenés
Improving the Prognosis of Patients with Type 2 Diabetes Slide 47. UKPDS: Association of HbA1C and Risk Reduction. 1% csökkenés a HbA1c szintben: Diabétesszel összefüggő halálozás 21 % Myocardialis infarctus 14 % Perifériás vascularis betegség 43 % Microvascularis szövődmény 37 % On average, each 1% decrease in HbA1C reduces the risk of type 2 diabetes- related death by 21%, myocardial infarction by 14%, peripheral vascular disease by 43%, microvascular disease by 37%, and cataract extraction by 19%. Each 1% increase in HbA1C is therefore associated with an unacceptable burden of premature death, and of morbidity that will seriously impair patients’ quality of life.

34
A STENO-2 vizsgálat elsődleges végpontjának alakulása
Gaede P. et al: N Engl J Med 348: , 2003.

35
A STENO-2 vizsgálat eredménye
Gaede P. et al: N Engl J Med 348: , 2003.

36
A STOP-NIDDM vizsgálat Chiasson JL et al: Lancet 359: , 2002.

37
A tanulmány terve Placebo TID (n = 700) Acarbose 100 mg TID (n = 700)
-1 36 6 12 18 24 30 39 Hónapok 1 2 3 4 5 7 8 9 10 11 13 14 15 Látogatások száma Placebo n = 1400 Placebo Chiasson, J.-L. et al. Diabetes Care 21: , 1998.

38
glukóztoleranciára IGT egyénekben
Az acarbose hatása a glukóztoleranciára IGT egyénekben ITT Glukóztolerancia a kezelés végén (%) NGT IGT T2DM Acarbose (n = 682) 35.3* * Placebo (n = 686) *p< 0.001
 NGT. IGT. T2DM. Acarbose. (n = 682) 35.3* * Placebo. (n = 686) *p<")
39
Number of subjects with CV - events*
Acarbose Placebo Cardiovascular Death Myocardial Infarction Angina Cong. Heart Failure Stroke/Cerebrovasc. Acc Peripheral Vascular Dis Revascularization Proc Any Cardiovascular Event Markus Rupp: created * subjects with prospectively defined events in STOP-NIDDM study protocol; post-hoc adjudicated via a study independent, blinded experts committee

40
Time to any cardiovascular event Days after Randomization
(first event only) ITT Survival distribution function Mean treatment duration 1.00 0.99 0.98 Acarbose 0.97 0.96 Markus Rupp: created 0.95 Placebo 0.94 p = 0.93 1400 1300 1200 1100 1000 900 800 600 500 400 300 200 100 700 1500 Days after Randomization
 ITT. Survival distribution function. Mean treatment duration Acarbose Markus Rupp: created Placebo p = Days after Randomization.")
41
CV - events : Relative Risk Reduction
No subjects EVENTS AC (n=682) PL (n=686) Risk Reduction p-value 0.5 1.0 1.5 2.0 Coronary heart disease Myocardial Infarct % Angina % Revasc. Procedure % CV death % Congestive heart failure Cerebrovasc. Accident/ % Stroke Peripheral Vasc. Disease Any prespecified CV event % Markus Rupp: created Favors Acarbose Favors Placebo
 PL. (n=686) Risk Reduction. p-value Coronary heart disease. Myocardial Infarct % Angina % Revasc. Procedure % CV death % Congestive heart failure Cerebrovasc. Accident/ % Stroke. Peripheral Vasc. Disease Any prespecified CV event % Markus Rupp: created Favors. Acarbose. Favors. Placebo.")
42
Glucobay® lassítja az intima-media megvastagodását dysglycaemias betegekben
Hanefeld M et al. Stroke 2004

43
Oralis antidiabetikumok antihypertensiv hatással
Effect of acarbose on onset of hypertension* n = 78 (11.4%) n = 115 (16.8 %) Cox proportional hazards model: p = * According to the diagnosis of investigator ( definition: BP > 140/90 mmHg) Chiasson JL et al: Lancet 359: , 2002.
 n = 115. (16.8 %) Cox proportional hazards model: p = * According to the diagnosis of investigator ( definition: BP > 140/90 mmHg) Chiasson JL et al: Lancet 359: ,")
44
Oralis antidiabetikumok antihypertensiv hatással
Effect of acarbose on onset of hypertension* % without HT Mean treatment duration 100 98 96 94 92 90 88 86 84 82 80 78 Acarbose Placebo p = 100 200 300 400 500 600 700 800 900 1000 1100 1200 1300 1400 Days after randomisation - T * According to the diagnosis of investigator (definition: BP > 140/90 mmHg) Chiasson JL et al: Lancet 359: , 2002.
 Chiasson JL et al: Lancet 359: ,")
45
Rosiglitazone: potential to impact on CVD risk
RSG hyperglycemia Hyperglycemia Hypertension RSG HDL and sdLDL RSG BP Dyslipidemia RSG PAI-1 Hypofibrinolysis RSG microalbuminuria Microalbuminuria RSG IR INSULIN RESISTANCE Rosiglitazone (RSG) has a favorable impact on a wide range of cardiovascular disease risk factors including: insulin resistance1 hyperglycemia2 hypertension3 dyslipidemia4–6 microalbuminuria7 reduced vascular reactivity8 elevated plasminogen activator-1 (PAI-1)9 elevated C-reactive protein (CRP).10 By ameliorating these risk factors, rosiglitazone has the potential to decrease atherosclerosis/cardiovascular disease. 1. Carey DG. Obesity Res 2002; 10:1008–1015. 2. Lebovitz H, et al. J Clin Endocrinol Metab 2001; 86:280–288. 3. St John Sutton M, et al. Diabetes Care 2002; 25:2058–2064. 4. Cobitz A, et al. DALM Abstract and poster. 5. GlaxoSmithKline. Data on file. 6. Freed MI. Am J Cardiol 2002; 90:947–952. 7. Bakris G, et al. J Hum Hypertens 2003; 17:7–12. 8. Natali A, et al. Diabetes 2002; 51 (Suppl. 2):A142. 9. Freed M, et al. Diabetologia 2000; 43 (Suppl. 1):A267. 10. Haffner S, et al. Circulation 2002; 106:679–684. Endothelial dysfunction RSG CRP Inflammation RSG vascular reactivity Atherosclerosis, cardiovascular disease? Atherosclerosis, cardiovascular disease Festa A, et al. Circulation 2000; 102:42–47; Reaven GM, et al. Annu Rev Med 1993; 44:121–131.
 has a favorable impact on a wide range of cardiovascular disease risk factors including: insulin resistance1. hyperglycemia2. hypertension3. dyslipidemia4–6. microalbuminuria7. reduced vascular reactivity8. elevated plasminogen activator-1 (PAI-1)9. elevated C-reactive protein (CRP).10. By ameliorating these risk factors, rosiglitazone has the potential to decrease atherosclerosis/cardiovascular disease. 1. Carey DG. Obesity Res 2002; 10:1008– Lebovitz H, et al. J Clin Endocrinol Metab 2001; 86:280– St John Sutton M, et al. Diabetes Care 2002; 25:2058– Cobitz A, et al. DALM Abstract and poster. 5. GlaxoSmithKline. Data on file. 6. Freed MI. Am J Cardiol 2002; 90:947– Bakris G, et al. J Hum Hypertens 2003; 17:7– Natali A, et al. Diabetes 2002; 51 (Suppl. 2):A Freed M, et al. Diabetologia 2000; 43 (Suppl. 1):A Haffner S, et al. Circulation 2002; 106:679–684. Endothelial dysfunction. RSG CRP. Inflammation. RSG vascular reactivity. Atherosclerosis, cardiovascular disease Atherosclerosis, cardiovascular disease. Festa A, et al. Circulation 2000; 102:42–47; Reaven GM, et al. Annu Rev Med 1993; 44:121–131.")
46
Mean change in 24-hour ambulatory blood pressure (mm Hg)
Rosiglitazone: effect on blood pressure in type 2 diabetes over 52 weeks Systolic BP Diastolic BP 5 Glibenclamid (mean 10.5 mg/day) 4 RSG (8 mg/day) 3 2 Mean change in 24-hour ambulatory blood pressure (mm Hg) 1 –1 Rosiglitazone decreases systolic and diastolic blood pressure compared with optimally titrated sulfonylurea therapy in normotensive patients with type 2 diabetes. Patients (n = 203) were randomized to treatment with rosiglitazone (8 mg/day) or sulfonylurea (glyburide titrated to optimal glycemic control; mean 10 mg/day). Systolic and diastolic blood pressure were assessed over a 24-hour period at baseline and at week 52. At 52 weeks, both systolic and diastolic blood pressure were significantly reduced in the rosiglitazone group when compared with the sulfonylurea group. This was despite both groups achieving similar glycemic control. St John Sutton M, et al. Diabetes Care 2002; 25:2058–2064. * –2 –3 * n = Baseline (mmHg) Patients were treated for 52 weeks *P < 0.05 compared with glyburide Error bars = SE Adapted from St John Sutton M, et al. Diabetes Care 2002; 25:2058–2064.
 4. RSG (8 mg/day) Mean change in 24-hour ambulatory blood pressure (mm Hg) 1. –1. Rosiglitazone decreases systolic and diastolic blood pressure compared with optimally titrated sulfonylurea therapy in normotensive patients with type 2 diabetes. Patients (n = 203) were randomized to treatment with rosiglitazone (8 mg/day) or sulfonylurea (glyburide titrated to optimal glycemic control; mean 10 mg/day). Systolic and diastolic blood pressure were assessed over a 24-hour period at baseline and at week 52. At 52 weeks, both systolic and diastolic blood pressure were significantly reduced in the rosiglitazone group when compared with the sulfonylurea group. This was despite both groups achieving similar glycemic control. St John Sutton M, et al. Diabetes Care 2002; 25:2058–2064. * –2. –3. * n = Baseline (mmHg) Patients were treated for 52 weeks. *P < 0.05 compared with glyburide. Error bars = SE. Adapted from St John Sutton M, et al. Diabetes Care 2002; 25:2058–2064.")
47
Antihypertensiv szerek antidiabetogen hatással
ACE-gátlók RRR CAPPP (captopril vs BB, DIU) % HOPE (ramipril vs placebo) % ALLHAT (lisinopril vs chlorthalidon) % SOLVD (enalapril vs placebo) %
 14 % HOPE (ramipril vs placebo) 34 % ALLHAT (lisinopril vs chlorthalidon) 22 % SOLVD (enalapril vs placebo) 74 %")
48
Antihypertensiv szerek antidiabetogen hatással
ARB-k RRR LIFE (losartan vs atenolol) % CHARM Overall (candesartan vs placebo) % SCOPE (candesartan vs placebo) % (NS) ALPINE (candesartan vs HCTZ) % VALUE (valsartan vs amlodipin) %
 25 % CHARM Overall (candesartan vs placebo) 22 % SCOPE (candesartan vs placebo) 19 % (NS) ALPINE (candesartan vs HCTZ) 87 % VALUE (valsartan vs amlodipin) 23 %")
49
A közelmúltban három cikk jelent meg a telmisartan inzulinsensitizer hatásáról, melynek hátterében PPARg-agonista hatást írtak le. Ez felvetette a telmisartan alkalmazásának előnyösségét az inzulinrezisztens hipertóniás betegekben. Ugyanakkor az Avandia mellett problémás lehet ennek a kommunikációja, továbbá problémás lehet, hogy a Boehringer – Avandiával nem rendelkezvén - elindulhat ezzel a kommunikációval. Mindenekelőtt tekintsük át a tényeket szakmai szempontból, majd térjünk vissza a kommunikáció kérdésére.

50
A szérum glukóz-, inzulin- és triglyceridértékének alakulása experimentális modellben
Benson SC et al: Hypertension 43: , 2004.

51
New-onset diabetes confers similar risk to established diabetes
100 4.70 5 No Diabetes 90 A 3.90 4 80 Previously Known Diabetes 3 Probability of Event-Free Survival (%) 70 Rate of Events (per 100 patient-years) C 60 2 50 0.97 1 New Diabetes B 40 30 A B C 3 6 9 12 15 Time to Event (yr) Groups N=795 uncomplicated, initially untreated HTN patients Verdecchia P, et al. Hypertension 2004;43:963-9.
 70. Rate of Events (per 100 patient-years) C New Diabetes. B A. B. C Time to Event (yr) Groups. N=795 uncomplicated, initially untreated HTN patients. Verdecchia P, et al. Hypertension 2004;43:")
52
A monoterápia igen gyakran nem elég...
Am J Kidney Dis 2000; 36:

53
Vércukor célértékek 2-es típusú diabetesben
> 7,5 > 6,5 < 6,5 HbA1C % > 9,0 < 7,5 Postprandiális plazma glukóz (mmol/l) > 7,0 > 6,0 < 6,0 Éhomi plazma glukóz (mmol/l) Microangiopathias kockázat Macroangiopathias kockázat Alacsony kockázat Diabetic Medicine 16: ; 1999.
 > 7,0. > 6,0. < 6,0. Éhomi plazma glukóz (mmol/l) Microangiopathias kockázat. Macroangiopathias kockázat. Alacsony kockázat. Diabetic Medicine 16: ;")
54
Distribution of glycaemia by risk status and by country
(CODE-2 Study) Liebl et al: Diabetologia 45: S23-S28, 2002.
 Liebl et al: Diabetologia 45: S23-S28,")
55
Köszönöm a figyelmet.

Hasonló előadás