Előadást letölteni
Az előadás letöltése folymat van. Kérjük, várjon

1
ÁLLAMI SZEREPEK AZ INFO- KAPITALIZMUSBAN 2020 Tamás Pál [MTA Szociológiai Intézet]
![ÁLLAMI SZEREPEK AZ INFO- KAPITALIZMUSBAN 2020 Tamás Pál [MTA Szociológiai Intézet]](http://images.slideplayer.hu/8/2163211/slides/slide_1.jpg "ÁLLAMI SZEREPEK AZ INFO- KAPITALIZMUSBAN 2020 Tamás Pál [MTA Szociológiai Intézet]")
2
AZ ALAPKÉRDÉS MEKKORA LEHET AZ ÁLLAM 2020BAN ÉS MIT CSINÁL? Újra indokolhatóak és védhetőek a viták s az abban születő válaszok a „good society”-ról és a „good governmentről”. NEM „csökkenteni/növelni” HANEM „kívánatos szerkezet/méret” NEMZETI/LOKÁLIS VÁLASZOK- társadalomszerkezetből, nemzetközi munkamegosztásbéli pozíciókból, kulturális mintákból következően

3
MEGHATÁROZÓK Az állami szerepeket- lehetőségeket és kötelezettségeket- együttesen meghatározza a következő 15 évben: a. Közjavak és közfunkciók átalakulása b. Társadalmi nyomásciklusok b1.felfogások a társadalmi jogokról b2.felfogások az ellenállas lehetséges és megengedett formáiról c. Bevételek alakulása

4
KÖZFUNKCIÓK UJ PRIORITÁSAI a.Képzett munkaerő: a beruházási döntéseket- más faktorokkal együtt, de azoknál jóval erősebben meghatározza. Reprodukciójának elősegítése a legfontosabb állami gazdaságpolitikai feladat. b.Népességszerkezet-hiány [család-, idős és migrációspolitika] c.A társadalom es a gazdaság növekvő [szociális, környezeti, biztonsági, technológiai] sebezhetőségének rendszerszerű kezelése

5
Társadalmi nyomásciklusok a.Konszenzuális elitek megléte- hiánya [ezek olyan elitek, amelyek minden megosztottságuk mellett is néhány fejlesztési alapértékben megegyeznek és azokat legfontosabb prioritásként kezelik]. Létrejöttük kataklizmák, vagy legalább generációs közös élmények után a legvalószínűbb. A renszerváltás Közép- Európában ilyen élmény volt, de konszenzuális hatása a 90es évek végére elenyészett. b.Generációs értékciklusok [türelmetlenségi hullámvölgyek] c.Konfrontációs- kooperációs ciklusok
![Társadalmi nyomásciklusok a.Konszenzuális elitek megléte- hiánya [ezek olyan elitek, amelyek minden megosztottságuk mellett is néhány fejlesztési alapértékben megegyeznek és azokat legfontosabb prioritásként kezelik].](http://images.slideplayer.hu/8/2163211/slides/slide_5.jpg "Létrejöttük kataklizmák, vagy legalább generációs közös élmények után a legvalószínűbb. A renszerváltás Közép- Európában ilyen élmény volt, de konszenzuális hatása a 90es évek végére elenyészett. b.Generációs értékciklusok [türelmetlenségi hullámvölgyek] c.Konfrontációs- kooperációs ciklusok.")
6
TARTÓS EGYENSÚLYHIÁNY A fiskális egyensúly- valamilyen értékek körül ingadozva- ugyan elérhető, de a gyorsan növekvő társadalomban, gazdaságban strukturálisan léteznek, sőt, meghatározóak dinamikus KIEGYENSÚLYOZATLANSÁGOK. Stacionárius [1-2%os növekedés még ilyen] társadalmakban ilyenek már anomáliák. Hogyan lehet majd akkor közös financiális térben azonos eszközökkel szabályozni az EU-15-öt és a –reményeink szerint ahhoz képest sokkal dinamikusabb- Eu-10-et?

7
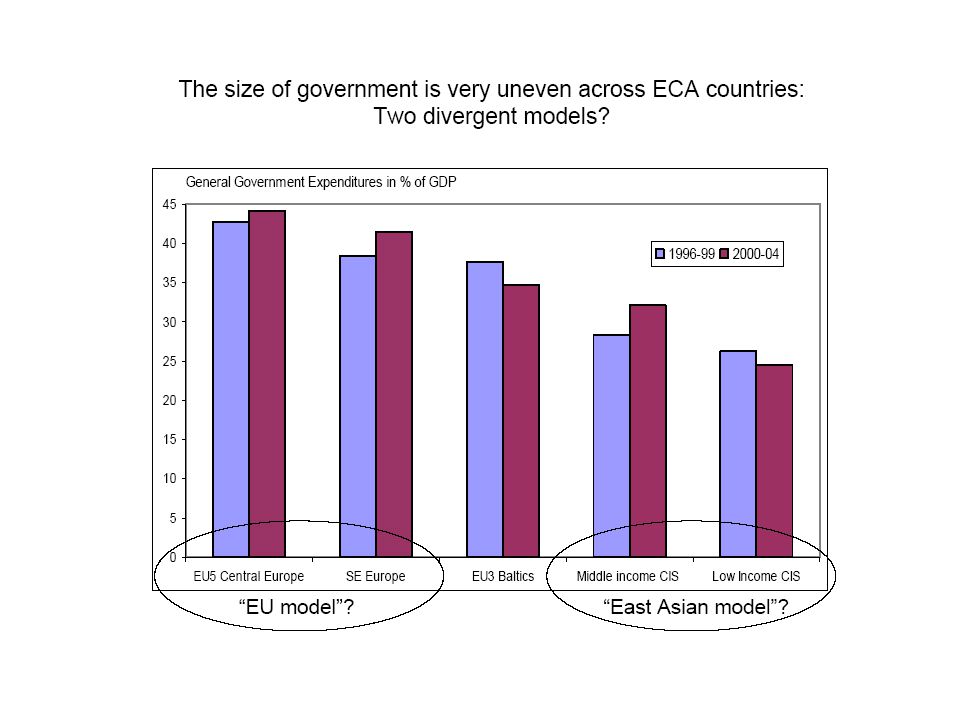
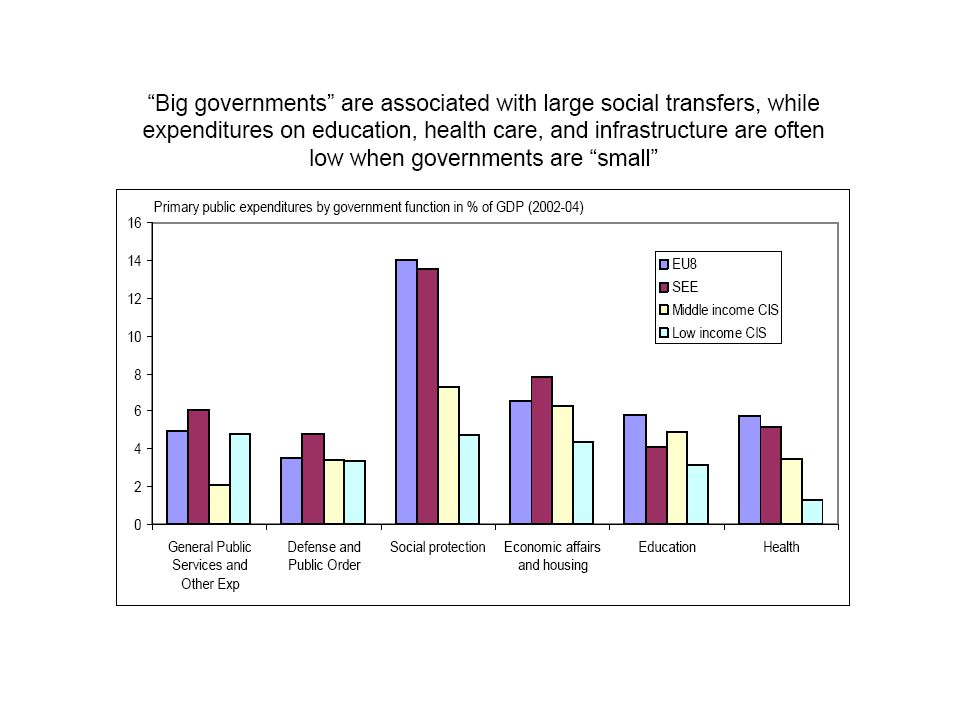
EU-8: PRIMARY EXPENDITURES/REVENUES

8
TRANSITION:DEFICITS-GROWTHS

9
REFORM TRAJECTORIES trans- parency effectiveness EUROPE AN CORE peripheri es

10
Tax revenue is high for income level, especially in Central Europe … Source: IMF World Economic Outlook database; IMF Government Financial Statistics database; New member states EU-15; Other high-income OECD*; Middle-income high-performing countries**; *USA, Australia and New Zealand; **The choice of middle-income high-performing countries varies from one chart to the next, in part dictated by data availability. This does not affect the comparisons made.

11
Public spending high for income level in Central Europe … Source: IMF World Economic Outlook database; IMF Government Financial Statistics database; OECD in figures 2004 edition New member states EU-15; Other high-income OECD*; Middle-income high-performing countries**; *USA, Australia and New Zealand; **Costa Rica, Israel, Korea, Malaysia, Singapore, Thailand and Tunisia

12
TAX COMPOSITION STRUCTURE Source: IMF World Economic Outlook database; OECD in figures 2004 edition * Malaysia, Tunisia, Brazil, Korea and Mexico; ** Greece, Ireland, Portugal and Spain; ***Australia, Japan, New Zealand and USA

15
3% 6% Size of government (percent of GDP) Growth rate of the economy A At some point, however, continued expansion of government will retard growth (moves beyond B). B Size of Government – Growth Curve If governments undertake activities in the order of their productivity, the growth of government will initially promote economic growth (move from A to B).
..")
16
An increase in government spending of 10% (as a share of GDP) reduces annual growth by about 1%. The relationship between the size of government at the beginning of the decade and the growth rate of real GDP for that decade is displayed below. Total government expenditures (start of respective decade) Source: OECD, OECD Economic Outlook (various issues) and The World Bank, World Development Indicators, 2001, CD-ROM. Growth rate (respective decade) Govt Spending and Economic Growth 2 % 4 % 6 % 8 % 10 % 0 % 10 %20 %30 %40 %50 %60 %
 Source: OECD, OECD Economic Outlook (various issues) and The World Bank, World Development Indicators, 2001, CD-ROM. Growth rate (respective decade) Govt Spending and Economic Growth 2 % 4 % 6 % 8 % 10 % 0 % 10 %20 %30 %40 %50 %60 %.")
17
PUBLIC RESPONSIBILITIES PUBLIC GOODSMARKET FAILURE CORRECTION MERIT GOODSORGANIZATIONAL INTEGRITY MINIMAL FUNCTIONS Defense Justice Crime Property rights Foreign relations Transport Primary and secondary education Healthcare Disaster relief - Poverty reduction Pensions Higher education Legality control Financial management -HRM INTERMEDIATE FUNCTIONS Infrastrructure Preventive health Utilities Antitrust Financial regulation Housing Arts Sports Local communities Unemployment insurance Industrial development Planning Coordination Normalisation ADVANCED FUNCTIONS Urban development Environment protection Competition Consumer protection SMEs Innovation, R&D Gender equality Support for minorities Social integration Equal opportunities Peroformance management Accountability Citizen’s participation

18
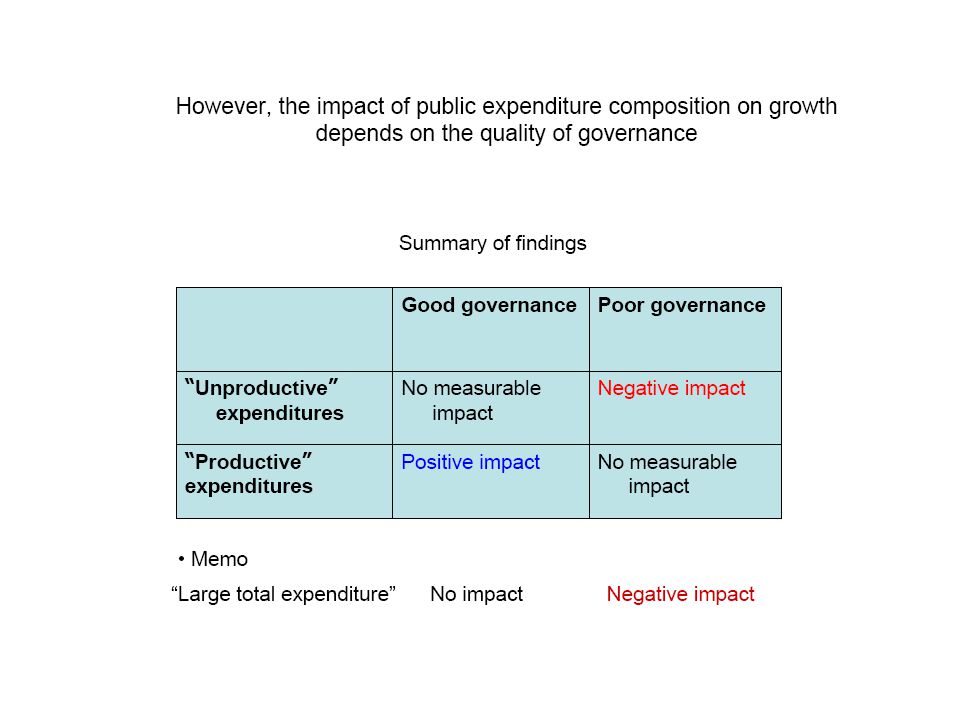
QUALITY OF GOVERNANCE EFFECTS

19
FENNTARTHATÓ ALLAMHÁZTARTÁSOK

20
The scope of public sector activities The scope of public sector activities consists of: 1)The public sector as a producer (direct use of resources in the public sector, exhaustive expenditures, Pigou 1947). 2)Public sector as a redistributors of income and wealth (redistributive expenditures). 3)Public regulation. Various regulatory measures have significant economic effects. 4)Public and private sector co-operation has become more common. These are called public-private partnership projects (ppp projects). They mix public and private activities. Analogous cases with ppp projects relate to social insurance.
Public sector as a redistributors of income and wealth (redistributive expenditures). 3)Public regulation. Various regulatory measures have significant economic effects. 4)Public and private sector co-operation has become more common. These are called public-private partnership projects (ppp projects). They mix public and private activities. Analogous cases with ppp projects relate to social insurance..")
21
SIZE OF THE PUBLIC SECTOR In 2000, public expenditures in relation to GDP accounted, on average, for 46.4 per cent in the EU countries, the range being 32.6 to 57.7 per cent. The total tax rates varied between 31.1 and 54.2 per cent, the average being 41.6 per cent. Public consumption expenditures in relation to GDP fluctuated between 13.4 and 26.2 per cent, with 19.9 per cent being the average. Public investments in relation to GDP were the highest in Greece (4.1%) and the lowest in the United Kingdom (1.2%). On average, there were 74 public sector employees per 1,000 inhabitants in the EU countries in 2000, varying between 47 (Greece) and 152 (Denmark).
 and the lowest in the United Kingdom (1.2%). On average, there were 74 public sector employees per 1,000 inhabitants in the EU countries in 2000, varying between 47 (Greece) and 152 (Denmark)..")
22
Total government spending (as a share of GDP) IRELAND I.The Rise and Fall of Government Expenditures Measured as a share of GDP, the government spending of Ireland rose throughout the 1960- 1985 period, but it declined sharply in the late 1980s and again during the latter half of the 1990s. 25 % 30 % 35 % 40 % 45 % 50 % 55 % 1970197519851990199520001980 Total government spending

23
Ireland’s top marginal tax rates (%) Ireland’s Top Marginal Tax Rates As shown here, Ireland has reduced both personal and corporate income tax rates substantially since the mid-1980s. 20 % 30 % 40 % 50 % 60 % 198219861994199820021990 70 % Personal income tax Corporate income tax

24
Ireland’s inflation rate (annual change in CPI %) Ireland’s inflation Rate Compared to 1970-1985, Ireland’s inflation rate was both lower and more stable during the 1990s. 5 % 10 % 15 % 20 % 25 % 1970197519851990199520001980 0 %

25
MANAGING FOR RESULTS IN CENTRAL & EASTERN EUROPE: CONTRASTING CONTEXT „OLD” OECDCENTRAL-EASTERN EUROPE Dominant political regime ParliamentaryPARLIAMENTARY Government managerial tradition BureaucraticClientelistic Government size (expenditure/GDP) 45%22% Dependance from commodities (share of govt revenues) 2%15% Poverty rate7%23% Elderly/working age population 36%~40% Average ranking in transparency index 23~40
 45%22% Dependance from commodities (share of govt revenues) 2%15% Poverty rate7%23% Elderly/working age population 36%~40% Average ranking in transparency index 23~40")
26
MANAGING FOR RESULTS ON THE EUROPEAN PERIPHERY „OLD” OECDTRANSITION COUNTRIES Driver of changeCrisis of bureaucratic stateDevelopment needs Strategic challengeResponsivenessLegitimacy, trust Main objectivesKeep service standards Deliver commitments Respond to individual needs Reduce poverty and inequality Enhance competitiveness Increase transparency and regularity MeanEmpower managersCreate managers RequirementAccountabilityGovernance, rule of law Key decisionmaking processes Cabinet Parliament Budget Departmental plans International agreements Planning Budgeting Legislation approval

27
TWO DIFFERENT STORIES „OLD” OECD: –New Public Management –Mixed top-down bottom-up approaches –Devolution with accountability –Series of linked initiatives TRANSITION –Development effectiveness –Top-down approach –Performance assesment with increased control –Tool fixation –Piecemeal implementation –Addressing postbureaucratic issues with a prebureaucratic state

28
Amongst a wider group of comparators including well performing middle-income countries health spending is not out of line … Source: WB SIMA; IMF World Economic Outlook database New member states EU-15; Other high-income Europe*; Middle-income high-performing countries**; *Switzerland and Norway; **Costa Rica, Chile, Israel, Korea, Malaysia, Mauritius, Singapore and Tunisia

29
….amongst a comparator group which includes well- performing middle-income countries pension spending looks high in Central Europe Source: “International Patterns of Pension Provision” by Palacious and Parrales-Miralles, 2000; IMF World Economic Outlook database; EUROSTAT New member states EU-15; Other high-income Europe*; Middle-income high-performing countries**; * Switzerland and Norway; ** Chile, Costa Rica, Israel, Korea, Malaysia, Mauritius, Singapore and Tunisia

30
Curbing high labor taxation and social benefits is made more urgent by shrinking labor force and growing elderly Working age population Elderly population Source: UN Population Prospects 2004; WB staff estimates

32
HU parameters- 2020 [Frames for institution building] Public expenditures/GDP -42-44% Tax rates -36-37% Public consumption expenditures/GDP -17-18% Public investments/GDP -2-2.5% Public sector employess/1000 inhabitants -60-80
![HU parameters [Frames for institution building] Public expenditures/GDP % Tax rates % Public consumption expenditures/GDP % Public investments/GDP % Public sector employess/1000 inhabitants](http://images.slideplayer.hu/8/2163211/slides/slide_32.jpg "HU parameters [Frames for institution building] Public expenditures/GDP % Tax rates % Public consumption expenditures/GDP % Public investments/GDP % Public sector employess/1000 inhabitants")
33
STRATÉGIAI DILEMMÁK a.Megváltozik a deficits/growths hatás. Felértékelődik a quality if government[ mérsékeli a size hatást]. b.A transparency-effectiveness trajectory-t csak néhány ágazat/város éri el stabilan- a többiek ki/be c.kicsinyíteni, vagy gyomlálni? Nem térünk le az európai alapmodellről strukturálisan d.jóléti/developmentalista arányvaltozás [2020 Európa kezd developmentalista lenni megint- erősebben lehetünk mi is] e.Minimalistic public responsabilites egyre drágább, köztes funkciók leépülnek de szelektíven megmaradnak az advanced functions

Hasonló előadás


 MORE?” symposium Washington.>")


>")
