Előadást letölteni
Az előadás letöltése folymat van. Kérjük, várjon

1
Csalás a kompetenciamérés tesztjein empirikus kísérlet a kompetenciamérés megbízhatóságának tesztelésére (előzetes eredmények) Horn Dániel MTA KTI és ELTEcon horn@econ.core.hu Egészség és Munkaerőpiac konferencia Szirák, 2011. november 4-5.

2
tartalom • A Jacob-Levitt módszer rövid bemutatása • A kompetenciamérésről röviden • A csalási arány becslése – J-L módosításával • Robosztussági tesztek (Megj.: eredmények nem véglegesek!)
")
3
A Jacob-Levitt módszer

4
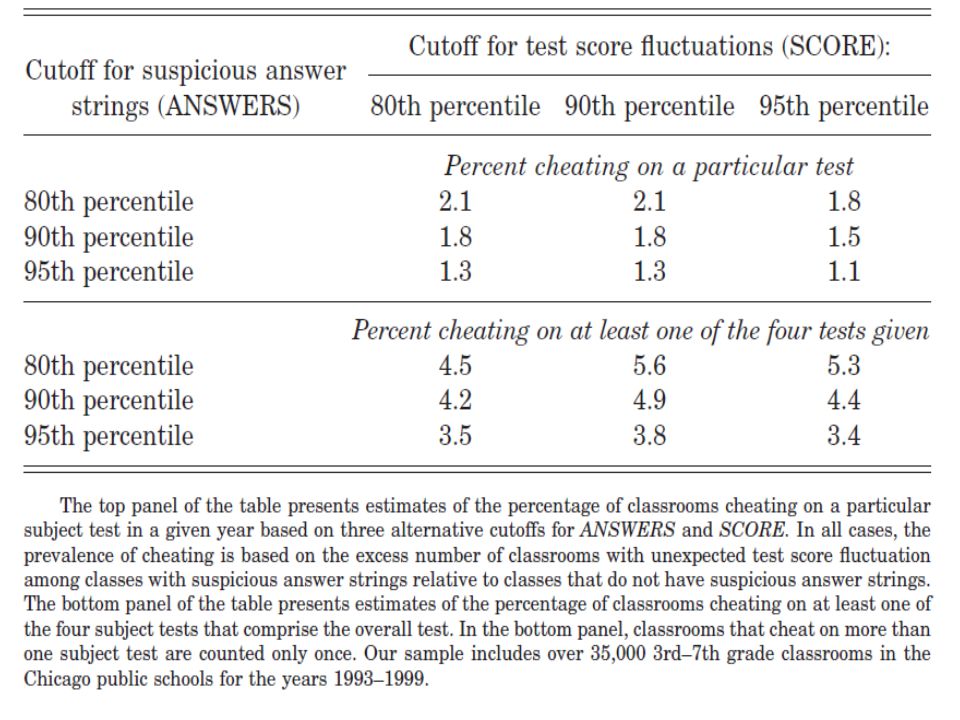
Rotten Apples • Jacob és Levitt 2003, QJE • Chicagoi általános iskolák – 1993-2000 – 3-7. évfolyam – Iowa Test of Basic Skills – csak feleletválasztós kérdések (multiple choice) – tanárok „javítják” • Két indikátor a csalásra: – 1. indikátor – nagy tesztpontszám változás (large test score fluctuation) – 2. indikátor – gyanús válaszadási minták (suspicious answer strings) • 4 mérték (4 measures – M1, M2, M3 és M4)
 – tanárok „javítják • Két indikátor a csalásra: – 1. indikátor – nagy tesztpontszám változás (large test score fluctuation) – 2. indikátor – gyanús válaszadási minták (suspicious answer strings) • 4 mérték (4 measures – M1, M2, M3 és M4).")
5
1. indikátor nagy tesztpontszám változás ahol rankgain a c osztály, b teszten t évben elért percentilis-rang változása (percentile rank increase)
.")
6
2. indikátor gyanús válaszadási minták • M1 – annak a valószínűsége, hogy diákok egy csoportja egymás után következő kérdésekre ugyan azt a választ adja. Minél kisebb a valószínűség, annál valószínűbb, hogy csalnak. – (probability of blocks of identical answer strings)
.")
7
2. indikátor gyanús válaszadási minták • M2 (átlag) és M3 (szórás) – osztályszintű aggregált statisztikája annak, hogy mennyire volt váratlan az adott kérdésre adott válasz.
 és M3 (szórás) – osztályszintű aggregált statisztikája annak, hogy mennyire volt váratlan az adott kérdésre adott válasz..")
8
2. indikátor gyanús válaszadási minták • M4 – a helyes válaszok aránya képességszintenként. ennek eltérése az országos átlagtól.

9
2. indikátor gyanús válaszadási minták • A 2. indiátor a mértékek rangérték- négyzetének összege (majd ennek a rangsora).
..")
10
Intuíció

12
Intuíció kritikája • Az 1. indikátorban lehet első és másodfajú hiba is • A 2. indikátor sorba rendezésével elveszítjük a legfontosabb információt: a kilógó eseteket. • Vagyis szükség volna egy küszöbértékre, ahol a „nem csaló” társadalom állna ugyanezen mértékek alapján.

13
Országos Kompetenciamérés

14
4th grade6th grade8th grade10th grade 20030 20 students from every school0 20 students from each track from each school 20040 20 students from every school 20 students from each track from each school 2006full cohort every student from a sample of 195 schoolsfull cohort 30 students from each track from each teaching site 2007full cohort every student from a sample of 200 schoolsfull cohort 30 students from each track from each teaching site 2008* every student from a sample of 200 schoolsfull cohort 2009* every student from a sample of 200 schoolsfull cohort 2010* every student from a sample of 200 schoolsfull cohort • Csak 2 év panel • Nem csak feleletválasztós kérdések • Nem a tanárok javítják • Item Response Theory!

15
A csalási arány becslése – némi módosítással

16
Item Response Theory • Ahol a – discrimination, b – difficulty, c – pseudoguessing • ez a három paraméter minden itemre adott. • és

18
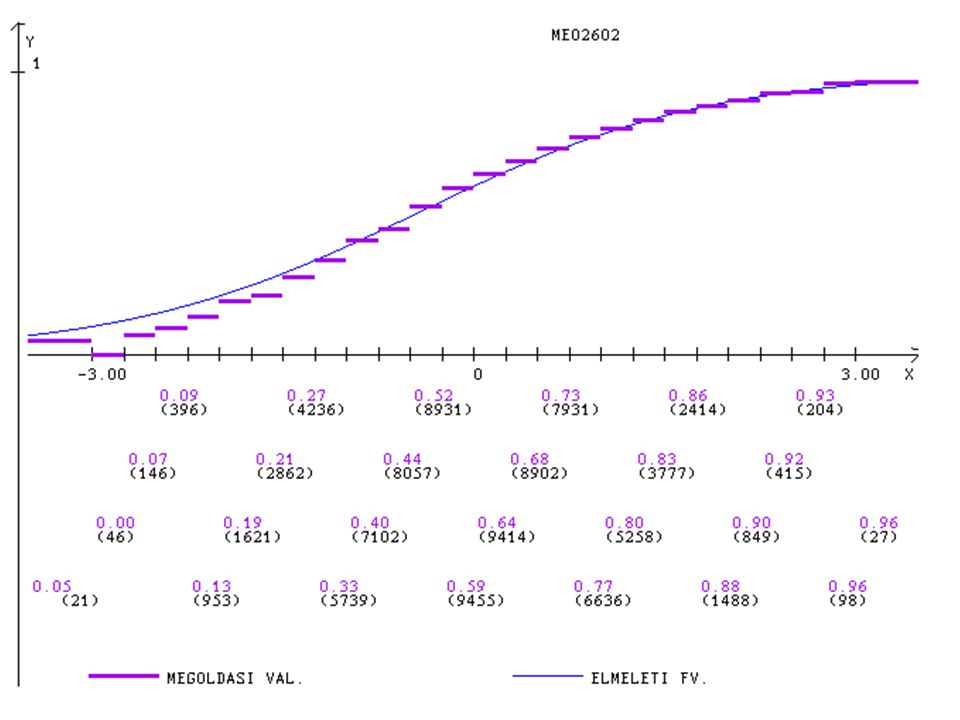
Folyamat • Az IRT által adott függvény segítségével: – kiszámoltuk diákonként, hogy mekkora valószínűséggel válaszol helyesen az adott itemre – ha ez a valószínűség nagyobb volt mint egy random szám (0 és 1 között) akkor az új adatbázisban helyesen válaszolt – ha nem, akkor helytelenül • a helytelen válaszok megoszlását – szintén random módon – a populáció megoszlásához igazítottuk.
 akkor az új adatbázisban helyesen válaszolt – ha nem, akkor helytelenül • a helytelen válaszok megoszlását – szintén random módon – a populáció megoszlásához igazítottuk.")
19
Folyamat • Az új adatbázisra kiszámoltam az M1, M2 M3 és M4-et. • ahol az eredeti mérték szignifikánsan nagyobb mint az új, ott feltehető a csalás (2008/8, matek) : Cheater# of classes % of classes # of students % of students # of schools 0114021,912443922,59848 1173333,313652533,761249 2161030,943259212,551221 366512,781357812,55580 4551,0610610,9853 sum52031001081951002444*
 : Cheater# of classes % of classes # of students % of students # of schools , , , , , , , , , ,9853 sum *.")
20
Robusztussági tesztek

21
Csalás vs. tesztpontszám változás CheaterTest score fluctuation (indicator 1) Difference in standardized test score between grade 8 and 10 00,080,0625 10,130,0713 20,21-0,0077 30,300,0267 40,48-0,0674 Total0,180,0369
 Difference in standardized test score between grade 8 and 10 00,080, ,130, ,21-0, ,300, ,48-0,0674 Total0,180,0369.")
22
Csalás vs. alulteljesítés UnderperformerFreq.Percentage 0172654,11 174123,23 239612,41 32226,96 41053,29

23
Csalás vs. alulteljesítés Ordered Logit underperformer indicator 2 (cheating indicator)0.254**0.295**0.166** (9.16)(10.01)(5.38) indicator 1, (test score fluctuation)0.321**0.154* (4.86)(2.32) size of school-0.092** (17.36) Observations 51875032 Absolute value of z statistics in parentheses * significant at 5%; ** significant at 1%
0.254**0.295**0.166** (9.16)(10.01)(5.38) indicator 1, (test score fluctuation)0.321**0.154* (4.86)(2.32) size of school-0.092** (17.36) Observations Absolute value of z statistics in parentheses * significant at 5%; ** significant at 1%.")
24
Konklúzió helyett

25
További teendők • Más évekre is megcsinálni ugyanezt (2008/6, 2010/8 és 2010/10 lehetséges még) • Nem csak matekra, hanem olvasásra is • és beépíteni az itt kapott javaslatokat…
 • Nem csak matekra, hanem olvasásra is • és beépíteni az itt kapott javaslatokat…")
26
Köszönöm a figyelmet! horn@econ.core.hu

27
Indicator 1 Large test score fluctuation where rankgain is the percentile rank increase for class c in subject b in year t

28
Indicator 2 Suspicious answer strings • Measure 1 (M1) 1)estimates the probability of each answer in each item for each student where Y is the response for student s in class c on item i. J is the number of possible responses (four), X is a vector of student characteristics, that includes past and future test scores, and some background data (free lunch, gender and race)
, X is a vector of student characteristics, that includes past and future test scores, and some background data (free lunch, gender and race).")
29
Indicator 2 Suspicious answer strings • Measure 1 (M1) 2) Calculates the probability for each student for the answer s/he actually gave where k is the response the student gave on the specific question 3)Calculate this probability for a (large) set of consequtive questions, from item m to item n
 2) Calculates the probability for each student for the answer s/he actually gave where k is the response the student gave on the specific question 3)Calculate this probability for a (large) set of consequtive questions, from item m to item n")
30
Indicator 2 Suspicious answer strings • Measure 1 (M1) 4)Take the product of this across all students, who had the same responses for the given set of questions 5)Finally, take the minimum of these probabilities
 4)Take the product of this across all students, who had the same responses for the given set of questions 5)Finally, take the minimum of these probabilities")
31
Indicator 2 Suspicious answer strings • Measure 2 (M2) 1)Calculate the residual for each of the possible choices a student could have made for each item response j on item i by student s in classroom c. four separate residuals per student per item

32
Indicator 2 Suspicious answer strings • Measure 2 (M2) 2) sum the residuals for each response across students within a classroom (four measures per classroom per item) This measure is close to zero if there is no within class correlation across students in a given item That is, if students responded the same way to an item, this measure is very high.
 2) sum the residuals for each response across students within a classroom (four measures per classroom per item) This measure is close to zero if there is no within class correlation across students in a given item That is, if students responded the same way to an item, this measure is very high.")
33
Indicator 2 Suspicious answer strings • Measure 2 (M2) 3) take sum of squares across the four possible responses for each item for each classroom, and normalize by class size 4) take the average of this within classroom (and divide by the number of items)
 3) take sum of squares across the four possible responses for each item for each classroom, and normalize by class size 4) take the average of this within classroom (and divide by the number of items)")
34
Indicator 2 Suspicious answer strings • Measure 3 (M3) the third measure is simply the variance (as opposed to the mean) of the same statistic M2 might be large due to teaching differences, e.g. teacher might emphasize a given topic more. „If the teacher changes answers for multiple students on selected questions, the within-class correlation on those particular questions will be extremely high, while the degree of within-class correlation on other questions is likely to be typical. This leads the cross-question variance in correlations to be larger than normal in cheating classrooms.” Note: this is also true if a teacher emphasizes a topic more through the year

35
Indicator 2 Suspicious answer strings • Measure 4 (M4) 1) calculate where q isc equal one if student s in classroom c answered item i correctly, and zero otherwise. A s is the aggregate score of student s, and z denotes a given score level, while ns A denotes the number of students with an aggregate score A. This shows the fraction of students at each aggregate score level, who answered each item correctly

36
Indicator 2 Suspicious answer strings • Measure 4 (M4) 2) calculate a measure of how much the response pattern of student s differed from the response pattern of other students with the same aggregate score 3) subtract out the mean deviation for all students with the same aggregate score, Z A, and sum the students within each classroom to obtain the fourth indicator
 2) calculate a measure of how much the response pattern of student s differed from the response pattern of other students with the same aggregate score 3) subtract out the mean deviation for all students with the same aggregate score, Z A, and sum the students within each classroom to obtain the fourth indicator")
37
Indicator 2 Suspicious answer strings Indicator 2 is the sum of squares of the rank value of these measures The Jacob-Levitt estimates:

Hasonló előadás


 MORE?” symposium Washington.>")


 n Áttekintés n Példák.>")
