Előadást letölteni
Az előadás letöltése folymat van. Kérjük, várjon

1
Biometria I. SANB_BI1019 Pearson-féle Chi-négyzet (χ2) teszt Molnár Péter Állattani Tanszék pmolnar@mail.ucf.edu
 teszt Molnár Péter Állattani Tanszék")
2
2. Van-e összefüggés a iskolában eltöltött évek száma (ed) és a családi jövedelem (Income) között Problémák: Korreláció : Feltesszük, hogy a kapcsolat lineáris (egyenes illesztés hibája)
 és a családi jövedelem (Income) között Problémák: Korreláció : Feltesszük, hogy a kapcsolat lineáris (egyenes illesztés hibája).")
3
Problémák Alternatív kérdésfelvetés: Az iskolában eltöltött időnek van-e szignifikáns hatása a későbbi fizetésre? Student’s t-test??? -Több csoportot kell összehasonlítani ANOVA (Variancia Analízis) -Nem normális az eloszlás Nem parametrikus módszerek
 -Nem normális az eloszlás Nem parametrikus módszerek.")
4
ANOVA Alkalmazási feltételek A függő változó magas mérési szintű (legalább intervallum szintű) Normál eloszlás (vagy legalább szimmetrikus) A vizsgált csoportokban az elemszám közel azonos, A függő változó szórása azonos, vagy legalább, a szórás nem korrelál a csoportátlaggal
 Normál eloszlás (vagy legalább szimmetrikus) A vizsgált csoportokban az elemszám közel azonos, A függő változó szórása azonos, vagy legalább, a szórás nem korrelál a csoportátlaggal")
5
Pearson-féle Chi-négyzet (χ2) teszt Matematikai modell jóságának a vizsgálata Adatok függetlenségének tesztelésére Feltételek: elegendő elemszám
 teszt Matematikai modell jóságának a vizsgálata Adatok függetlenségének tesztelésére Feltételek: elegendő elemszám")
6
Ha az X i –k független, normális eloszlásu független változók 0 átlaggal és 1 szórással, akkor a belőlük képzett valószínüségi változó A chi-négyzet eloszlást követi k szabadsági fokkal.

7
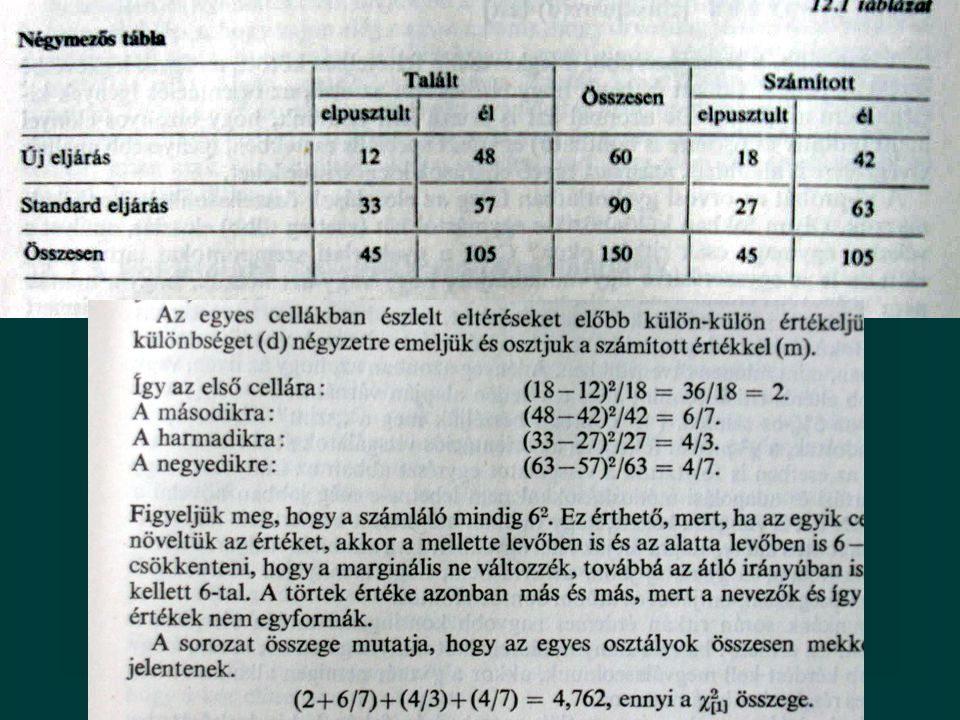
Matematikai modell jóságának a vizsgálata n lehetséges kimenetel Oi=megfigyelt Ei=számított n-1=szabadsági fok

8
For example, to test the hypothesis that a random sample of 100 people has been drawn from a population in which men and women are equal in frequency, the observed number of men and women would be compared to the theoretical frequencies of 50 men and 50 women. If there were 45 men in the sample and 55 women, then If the null hypothesis is true (i.e., men and women are chosen with equal probability in the sample), the test statistic will be drawn from a chi-square distribution with one degree of freedom. Though one might expect two degrees of freedom (one each for the men and women), we must take into account that the total number of men and women is constrained (100), and thus there is only one degree of freedom (2 − 1). Alternatively, if the male count is known the female count is determined, and vice-versa. degree of freedom Consultation of the chi-square distribution for 1 degree of freedom shows that the probability of observing this difference (or a more extreme difference than this) if men and women are equally numerous in the population is approximately 0.3. This probability is higher than conventional criteria for statistical significance (.001-.05), so normally we would not reject the null hypothesis that the number of men in the population is the same as the number of women (i.e. we would consider our sample within the range of what we'd expect for a 50/50 male/female ratio.)chi-square distribution probabilitystatistical significance
, the test statistic will be drawn from a chi-square distribution with one degree of freedom. Though one might expect two degrees of freedom (one each for the men and women), we must take into account that the total number of men and women is constrained (100), and thus there is only one degree of freedom (2 − 1). Alternatively, if the male count is known the female count is determined, and vice-versa. degree of freedom Consultation of the chi-square distribution for 1 degree of freedom shows that the probability of observing this difference (or a more extreme difference than this) if men and women are equally numerous in the population is approximately 0.3. This probability is higher than conventional criteria for statistical significance ( ), so normally we would not reject the null hypothesis that the number of men in the population is the same as the number of women (i.e. we would consider our sample within the range of what we d expect for a 50/50 male/female ratio.)chi-square distribution probabilitystatistical significance.")
9
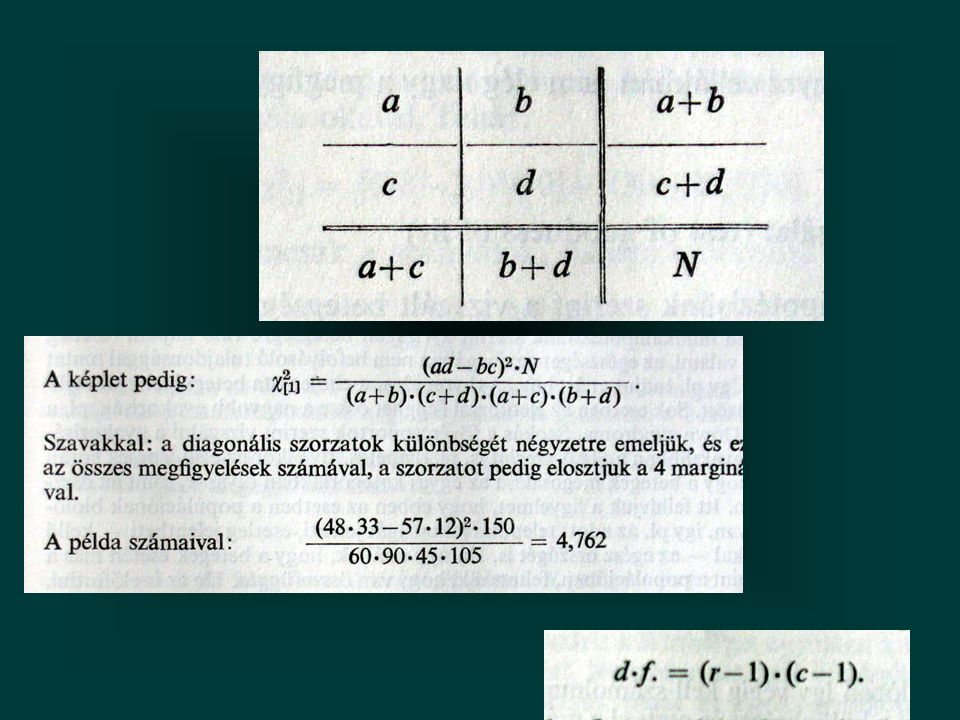
Függetlenség tesztelés Szabadságfok: (r − 1)(c − 1)
(c − 1)")
10
In statistics, contingency tables are used to record and analyse the relationship between two or more variables, most usually categorical variables. Suppose that we have two variables, sex (male or female) and handedness (right- or left-handed). We observe the values of both variables in a random sample of 100 people. Then a contingency table can be used to express the relationship between these two variables, as follows: right-handed left-handed TOTAL Male 43 9 52 female 44 4 48 TOTAL 87 13 100 The figures in the right-hand column and the bottom row are called marginal totals and the figure in the bottom right-hand corner is the grand total.
 and handedness (right- or left-handed). We observe the values of both variables in a random sample of 100 people. Then a contingency table can be used to express the relationship between these two variables, as follows: right-handed left-handed TOTAL Male female TOTAL The figures in the right-hand column and the bottom row are called marginal totals and the figure in the bottom right-hand corner is the grand total..")
Hasonló előadás


 MORE?” symposium Washington.>")


>")
